Marketers Guide to Conversion Rate Optimisation
Updated 31 May 2021 (Published 2 August 2016) by Miles in Digital Marketing
We’re all seen split testing when it comes to advertising – you run two ads with different image or copy, and see which one gleans the best response. Well, conversion rate optimisation (CRO) is a similar method of testing and continuous improvement.

In this article, I’ll take you through the basics of conversion rate optimisation, and how it can massively boost your bottom line. Here at Bam Creative, we’ve used this theory to improve returns of everything from email campaigns to event ticketing workflows, to lead generation pages and more.
What is Conversion Rate Optimisation (CRO)?
Conversion Rate Optimisation is a method to make a series of typically small changes to a website, to improve the percentage of visitors completing an action you want them to take. It requires both creative and analytical thinking and can be described as using both analytics and user feedback to improve the performance of a website element.
So how do we get started with CRO?
We recommend that you start by drawing out or describing a typical user flow. For this example, let’s say we have an end goal of increasing inbound enquiries from a form that is linked in our blog posts.
The user flow is;
- A user finds a link to your blog from a search engine or referring website
- The user visits and reads a blog post
- The user clicks on a Call to Action (CTA) panel
- The user then completes an enquiry form
- The end goal is that we want the user to complete an enquiry form and give us their details.
What can we optimise?
To increase the amount of users completing this form, we can look at various points of optimization, being;
- The enquiry form itself
- The call to action panel
- The blog post content
- The links that point to the blog
We will concentrate on two aspects, the form itself and the CTA panel that appears in blog posts. We are going to run two experiments here; the enquiry form and the Call To Action (CTA). For simplicity sake, we’ll work on one experiment, and then the other.
Important Tip
When running CRO experiments, it is important to only make small changes and test each change. If you undertake a radical change in every step of a workflow, you may see an increase or decline, and if you’ve made wholesale changes, you won’t know which element or elements made that impact.
So, with this in mind, we start on two experiments in our fictional example.
Experiment 1: Enquiry form optimization
The current enquiry form looks something like this;
As you can see, it is not overly appealing. We know, by looking at statistics, that only 15% of people who arrive at this form will complete it. This means 85% of people see the form, but do not give their details.
We determine that we could likely drop the comments field, since this form is specific to enquiries for polished widgets. We can include polished widgets in the email that is sent with the form, so we know which form the enquiry came from.
We also see that there is no mention of what you will do with the information, so we will recommend linking to a privacy policy, and mention that we won’t use the submitted details for spam.
Here’s how our new proposed form looks like;
This form opens with a friendly Tell me more! Headline, a few lines of text about why the user should enquire, and reiterates the ‘tell me more’ in the submit button.
Now we send 1,000 users to this new form, and compare it to the old statistics
| Old form | Variant A | |
| Page views | 1,000 | 1,000 |
| Form completions | 150 | 275 |
| Percentage | 15% | 27.5% |
After sending 1,000 visitors to our new form (which we call Variant A) we see that we now received 275 enquiries, meaning we lifted our completion rate from 15% to 27.5%, a huge increase in potential sales.
Next, we add an image of a typical widget just above the form and run the experiment again (Variant B). This time, we receive 310 enquiries off 1,000 users. Then, we may try changing the submit button colour (Variant C), and find that the enquiries drop down to 295 enquiries.
| Old form | Variant A | Variant B | Variant C | |
| Page views | 1,000 | 1,000 | 1,000 | 1,000 |
| Form completions | 150 | 275 | 310 | 295 |
| Percentage | 15% | 27.5% | 31% | 29.5% |
We settle on using Variant B, which is bringing in just over double the amount of enquiries than our original form.
Experiment 2: Call to action optimization
The original call to action in all our blog posts, was literally two lines of text at the end of each post.

We find that the content is very laid back, and not iterating the benefits of our widgets. Because it is plain text, it is also very easy to miss.
Our current statistics show that only 5% of people who read a blog post will click on the link. So, for every 1,000 readers, only 50 people will click.
So, we go about redesigning the call to action, to be a big box, with a coloured background and large text.
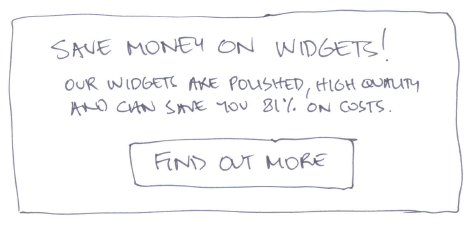
This CTA now has a headline that shows the main benefit (saving money), a follow-up sentence about how (they are polished and high quality) and backs it up with research (81% savings in costs).
We put this on a few high traffic posts, and watch our traffic numbers until we get 1,000 readers viewing it. What we find is that we have tripled the number of people clicking on the new CTA.
| Old CTA | Variant A | |
| Page views | 1,000 | 1,000 |
| Link clicks | 50 | 150 |
| Percentage | 5% | 15% |
We then run a few more variations, trying different headlines and colours, until we find variant C gives us 22% of viewers clicking the link.
| Old CTA | Variant A | Variant B | Variant C | |
| Page views | 1,000 | 1,000 | 1,000 | 1,000 |
| Link clicks | 50 | 150 | 172 | 220 |
| Percentage | 5% | 15% | 17.2% | 22% |
We’ve now conducted a number of variants with the two experiments, and it is time to pause for a moment, and take stock.
The value of improvements
At the start of this project, we discovered each sale brings us $100 in profit. We also know it takes three form completions to get a sale.
Now let’s crunch the numbers between what we knew was happening before, and what we have now achieved.
| Original | Improved CTA | |
| Blog visitors | 1,000 | 1,000 |
| CTA clicks | 50 | 220 |
By optimizing the call to action, we have taken the same amount of traffic (1,000) from 50 clicks, to 220.
| Form views | 50 | 220 |
| Form completes | 7.5 | 68.2 |
| Sales | 2.5 | 22.7 |
Using the optimized form, we now get 31% of users completing the form, instead of 15%. That means for our new audience of 220, we get 68.2 enquiries, and using the same 1/3 of enquiries lead to a sale approach, we now get 22.7 sales for every 1,000 blog visitors.
The financial outcome is;
| Original 1,000 blog visitors | $250 |
| Optimised CTA and form | $2,270 |
That is a whopping 908% improvement on the bottom line income, for the same 1,000 blog visitors.
Summary
Obviously, the above example campaign is a simplistic version of what occurs, and the results are typically not so huge. We have, however, seen improvements such as;
We worked with an event ticketing company to improve email invitations and ticket order forms to improve actual event attendance by 15%. We optimized a lead generation form to improve leads by 176% and increased the number of leads to other clients business by 500%.
Don’t overlook CRO as a way to increase new leads, business, sales or profits. It may be slow and time-intensive, but can pay off in big ways. Good luck!
Related Articles